Episodes A and B play real teleoperated episodes while the curve shows the dense per-frame predicted signed progress magnitude \(\hat{v}_{t}\) — positive for forward task progress and negative for regression. Click on the curve to scrub through the video.
Data
Our policy-training data is drawn from a single corpus of around 125 hours of successful, unannotated human-teleoperated T-shirt-folding demonstrations. On this task, episode length is a coarse proxy for execution efficiency: longer episodes tend to contain more hesitations, retries, and recoveries. To evaluate robustness as progressively more inefficient behavior is admitted into training, we define three nested, length-filtered tiers: \(\mathcal{D}_{1}\) (≤ 60s): 1,975 episodes (29.1 hours), \(\mathcal{D}_{2}\) (≤ 90s): 3,546 episodes (61.5 hours), and \(\mathcal{D}_{3}\) (≤ 120s): 5,718 episodes (124.7 hours). Policies are trained on the same underlying demonstrations, either with uniform weighting (vanilla BC) or WARP-based progress reweighting. A single WARP-RM model is used across all tiers: it is trained once on a fixed reference subset \(\mathcal{D}_{\mathrm{RM}}\) — the shortest demonstrations (≤ 59s, 1,807 episodes) — providing a clean reference signal for the canonical execution pace (\(\hat{v} = 1\)). For baseline comparisons, SARM requires human annotations, so an annotated supplement \(\mathcal{D}_{A}\) (929 expert demonstrations, 15.8 hours) is added, forming the augmented datasets \(\mathcal{D}_{4} = \mathcal{D}_{1} \cup \mathcal{D}_{A}\) and \(\mathcal{D}_{5} = \mathcal{D}_{2} \cup \mathcal{D}_{A}\); WARP-RM and all other baselines treat \(\mathcal{D}_{A}\) as unannotated.
Real-World Policy Rollouts
Across 380 real-world trials of T-shirt folding from a crumpled start, WARP-BC consistently completes more folds and completes them faster than vanilla BC and other baselines trained on the same demonstration corpus. Each video below shows all 20 evaluation trials for a tier, played simultaneously in a 4×5 grid. Use the selector to switch between models trained on each of the three demonstration tiers from the paper.
Videos played at 1× speed.
Method
Prior progress models are trained to predict how far along a trajectory is — the fraction of the demonstration that has elapsed so far. This is a noisy learning target, because the same elapsed fraction in two different demonstrations can correspond to very different amounts of actual task progress. WARP-RM instead learns a relative signal — how fast, and in which direction, the task is advancing — using a self-supervised target obtained by replaying successful demonstrations at non-uniform velocities.
Resample a successful trajectory with smoothly varying playback speeds (AR(1) in log-space) and Poisson-sampled reversals. The signed source-frame displacement from the window's first frame is the per-frame progress label — no human annotation required.
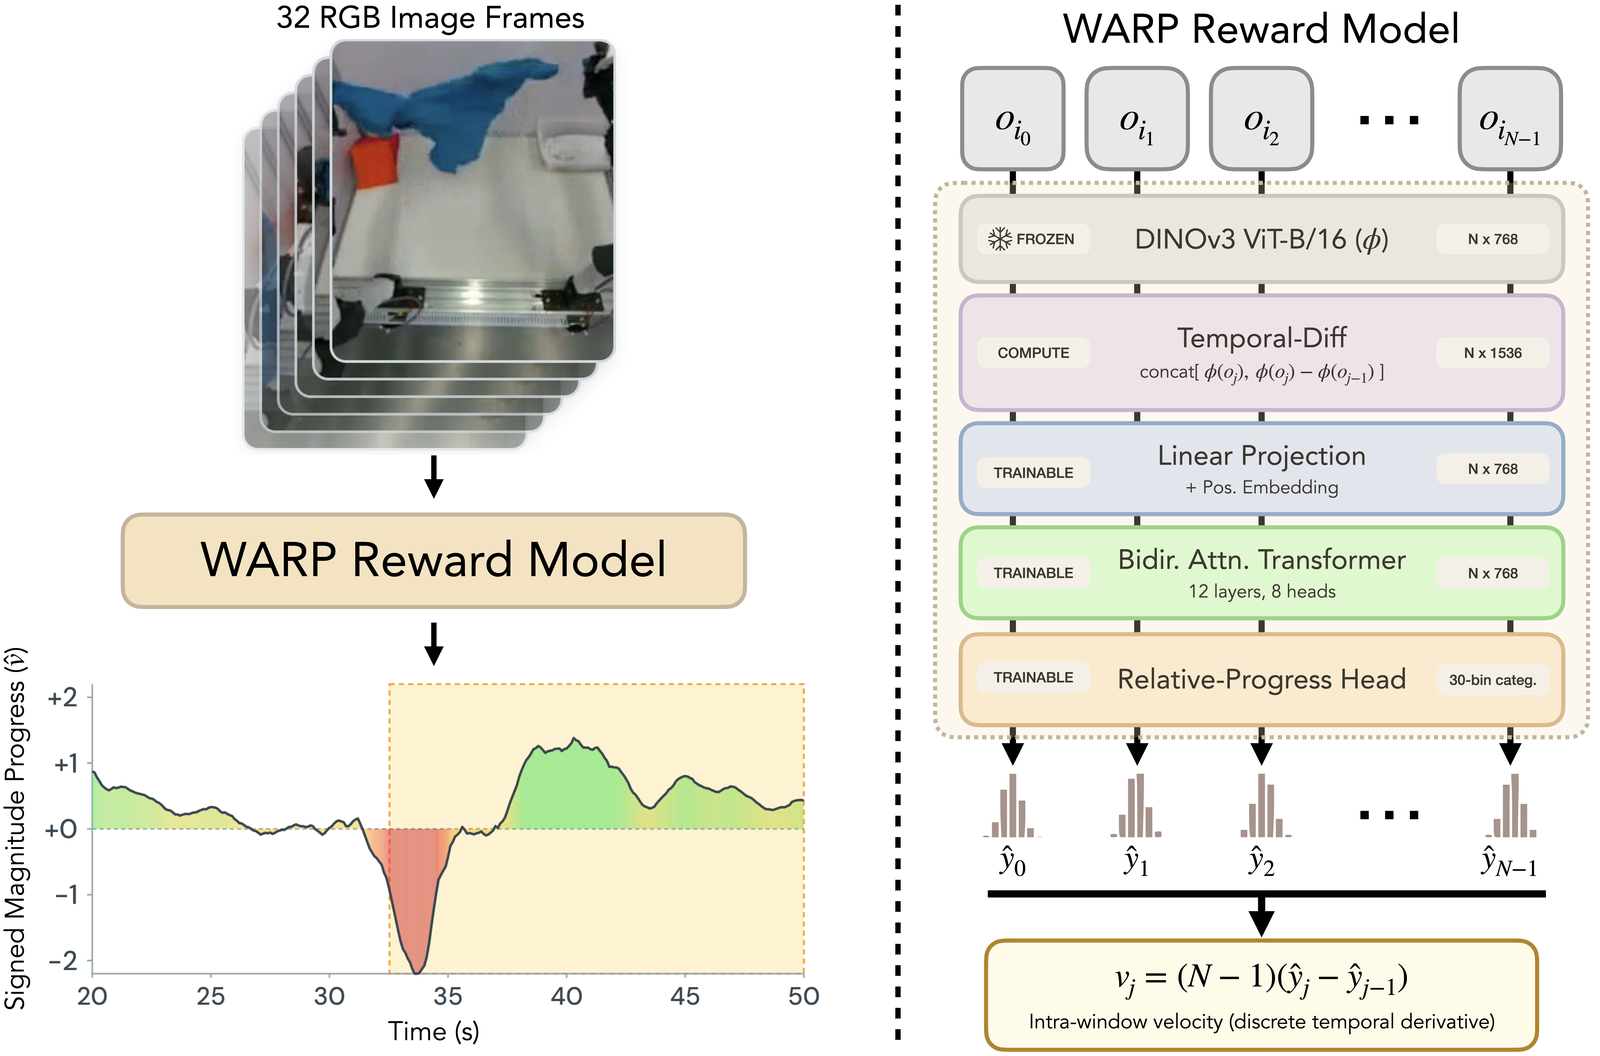
A frozen DINOv3 ViT-B/16 + 12-layer bidirectional transformer head outputs a per-frame categorical distribution over cumulative progress. Its temporal derivative gives the velocity \(\hat{v}_{t}\):
\(\hat{v}\) ≈ 1 → expert pace, \(\hat{v}\) ≈ 0 → stagnating, \(\hat{v}\) < 0 → regressing
For each training chunk, gate on the predicted velocity at its terminal frame. With \(\tau = 1.0\), only chunks ending in faster-than-expert progress are kept, and each is weighted continuously by its velocity:
\( w \;=\; \hat{v}_{\mathrm{end}} \cdot \mathbf{1}\{\,\hat{v}_{\mathrm{end}} > \tau\,\} \)
Quantitative Results
Cross-tier results on T-shirt folding
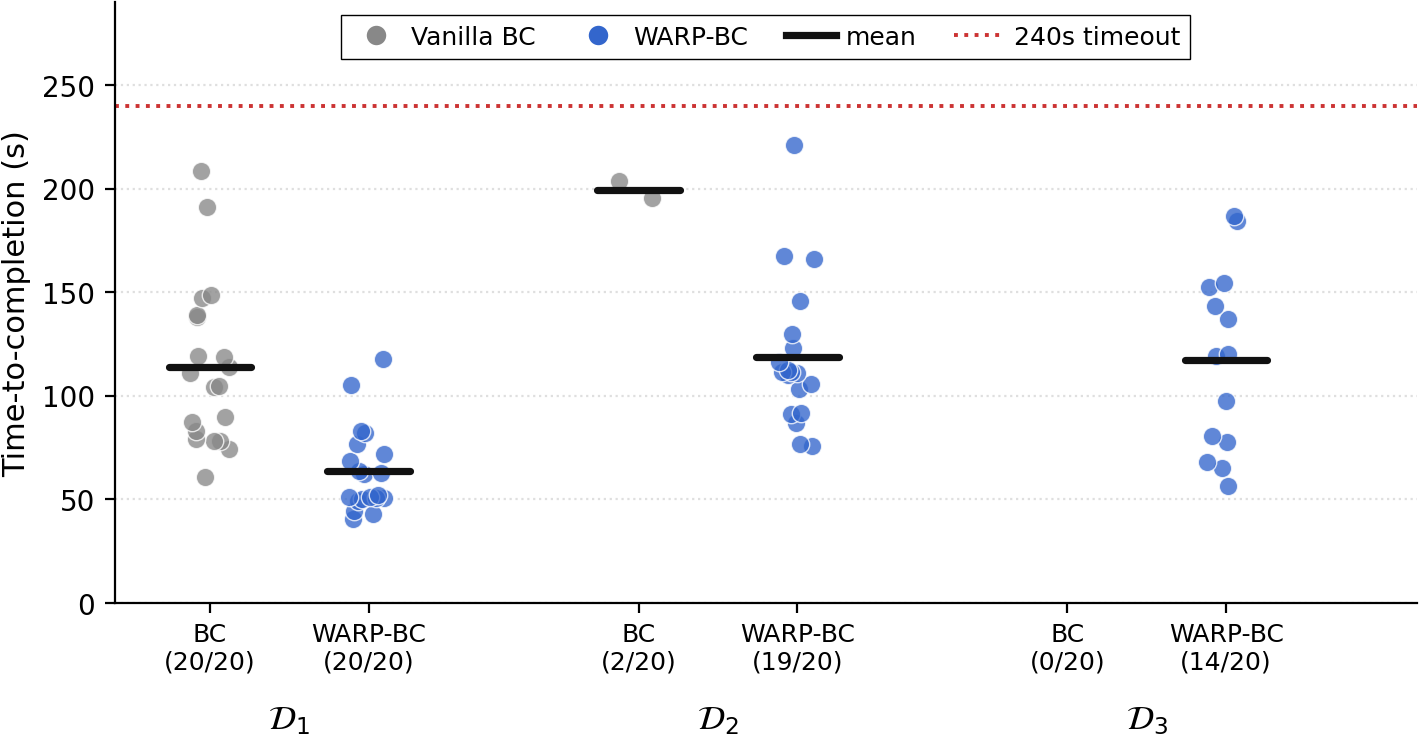
All policies are evaluated on 20 trials of T-shirt folding from a crumpled start with a 240s timeout. Mean time-to-completion (TTC) is reported over successful trials only. As the training pool admits more suboptimal demonstrations, vanilla BC degrades sharply while WARP-BC stays robust.
| Method | Metric | \(\mathcal{D}_{1}\) (≤60s) | \(\mathcal{D}_{2}\) (≤90s) | \(\mathcal{D}_{3}\) (≤120s) |
|---|---|---|---|---|
| Vanilla BC | Success ↑ | 20/20 | 2/20 | 0/20 |
| Mean TTC (s) ↓ | 113.8 | 199.0 | N/A | |
| Throughput (/hr) ↑ | 31.6 | 1.5 | 0.0 | |
| Action Chunks Kept | 100% | 100% | 100% | |
| WARP-BC | Success ↑ | 20/20 | 19/20 | 14/20 |
| Mean TTC (s) ↓ | 63.9 | 118.8 | 117.4 | |
| Throughput (/hr) ↑ | 56.3 | 27.4 | 16.3 | |
| Action Chunks Kept | 35.7% | 34.4% | 22.5% |
Matched baseline comparisons
Because SARM requires human-annotated subtask boundaries, all methods are evaluated on the augmented corpora \(\mathcal{D}_{4} = \mathcal{D}_{1} \cup \mathcal{D}_{A}\) and \(\mathcal{D}_{5} = \mathcal{D}_{2} \cup \mathcal{D}_{A}\), where \(\mathcal{D}_{A}\) is the annotated supplement (treated as unannotated by every method except SARM). WARP-BC sustains the highest throughput on both tiers and ties or leads on success — without the human labels SARM needs. SARM and SCIZOR collapse on the noisier \(\mathcal{D}_{5}\), while DemInf stays robust on success but at lower throughput.
| Method | Metric | \(\mathcal{D}_{4}\) | \(\mathcal{D}_{5}\) |
|---|---|---|---|
| SARM | Success ↑ | 19/20 | 2/20 |
| Mean TTC (s) ↓ | 90.5 | 156.0 | |
| Throughput (/hr) ↑ | 34.9 | 1.55 | |
| Action Chunks Kept | 78.5% | 66.6% | |
| DemInf | Success ↑ | 19/20 | 18/20 |
| Mean TTC (s) ↓ | 89.6 | 115.8 | |
| Throughput (/hr) ↑ | 35.2 | 25.3 | |
| Action Chunks Kept | 45.6% | 33.7% | |
| SCIZOR | Success ↑ | 19/20 | 2/20 |
| Mean TTC (s) ↓ | 98.4 | 206.2 | |
| Throughput (/hr) ↑ | 32.4 | 1.5 | |
| Action Chunks Kept | 77.9% | 66.7% | |
| WARP-BC | Success ↑ | 20/20 | 20/20 |
| Mean TTC (s) ↓ | 71.2 | 80.7 | |
| Throughput (/hr) ↑ | 50.6 | 44.6 | |
| Action Chunks Kept | 45.6% | 33.7% |
Ablations
All ablations are run on dataset \(\mathcal{D}_{2}\). Kept-train-samples reports the fraction of action chunks that survive the weighting filter.
| Variant | Success ↑ | Mean TTC (s) ↓ | Throughput (/hr) ↑ | Action Chunks Kept |
|---|---|---|---|---|
| Weighting function | ||||
| \(\tau = 0\) | 3/20 | 201.4 | 2.3 | 97.0% |
| \(\tau = 1\), max = 1 (binary) | 16/20 | 139.6 | 18.0 | 34.4% |
| \(\tau = 1\), continuous — WARP | 19/20 | 118.8 | 27.4 | 34.4% |
| RA-BC aggregation strategy | ||||
| Mean over 1s action chunk | 15/20 | 127.0 | 17.4 | 34.0% |
| Mean over 1s, one-chunk offset | 14/20 | 124.2 | 15.9 | 34.3% |
| Terminal \(\hat{v}_{end}\) — WARP | 19/20 | 118.8 | 27.4 | 34.4% |
| WARP sampler | ||||
| IID log-normal | 18/20 | 131.0 | 22.8 | 28.7% |
| AR(1) process — WARP | 19/20 | 118.8 | 27.4 | 34.4% |